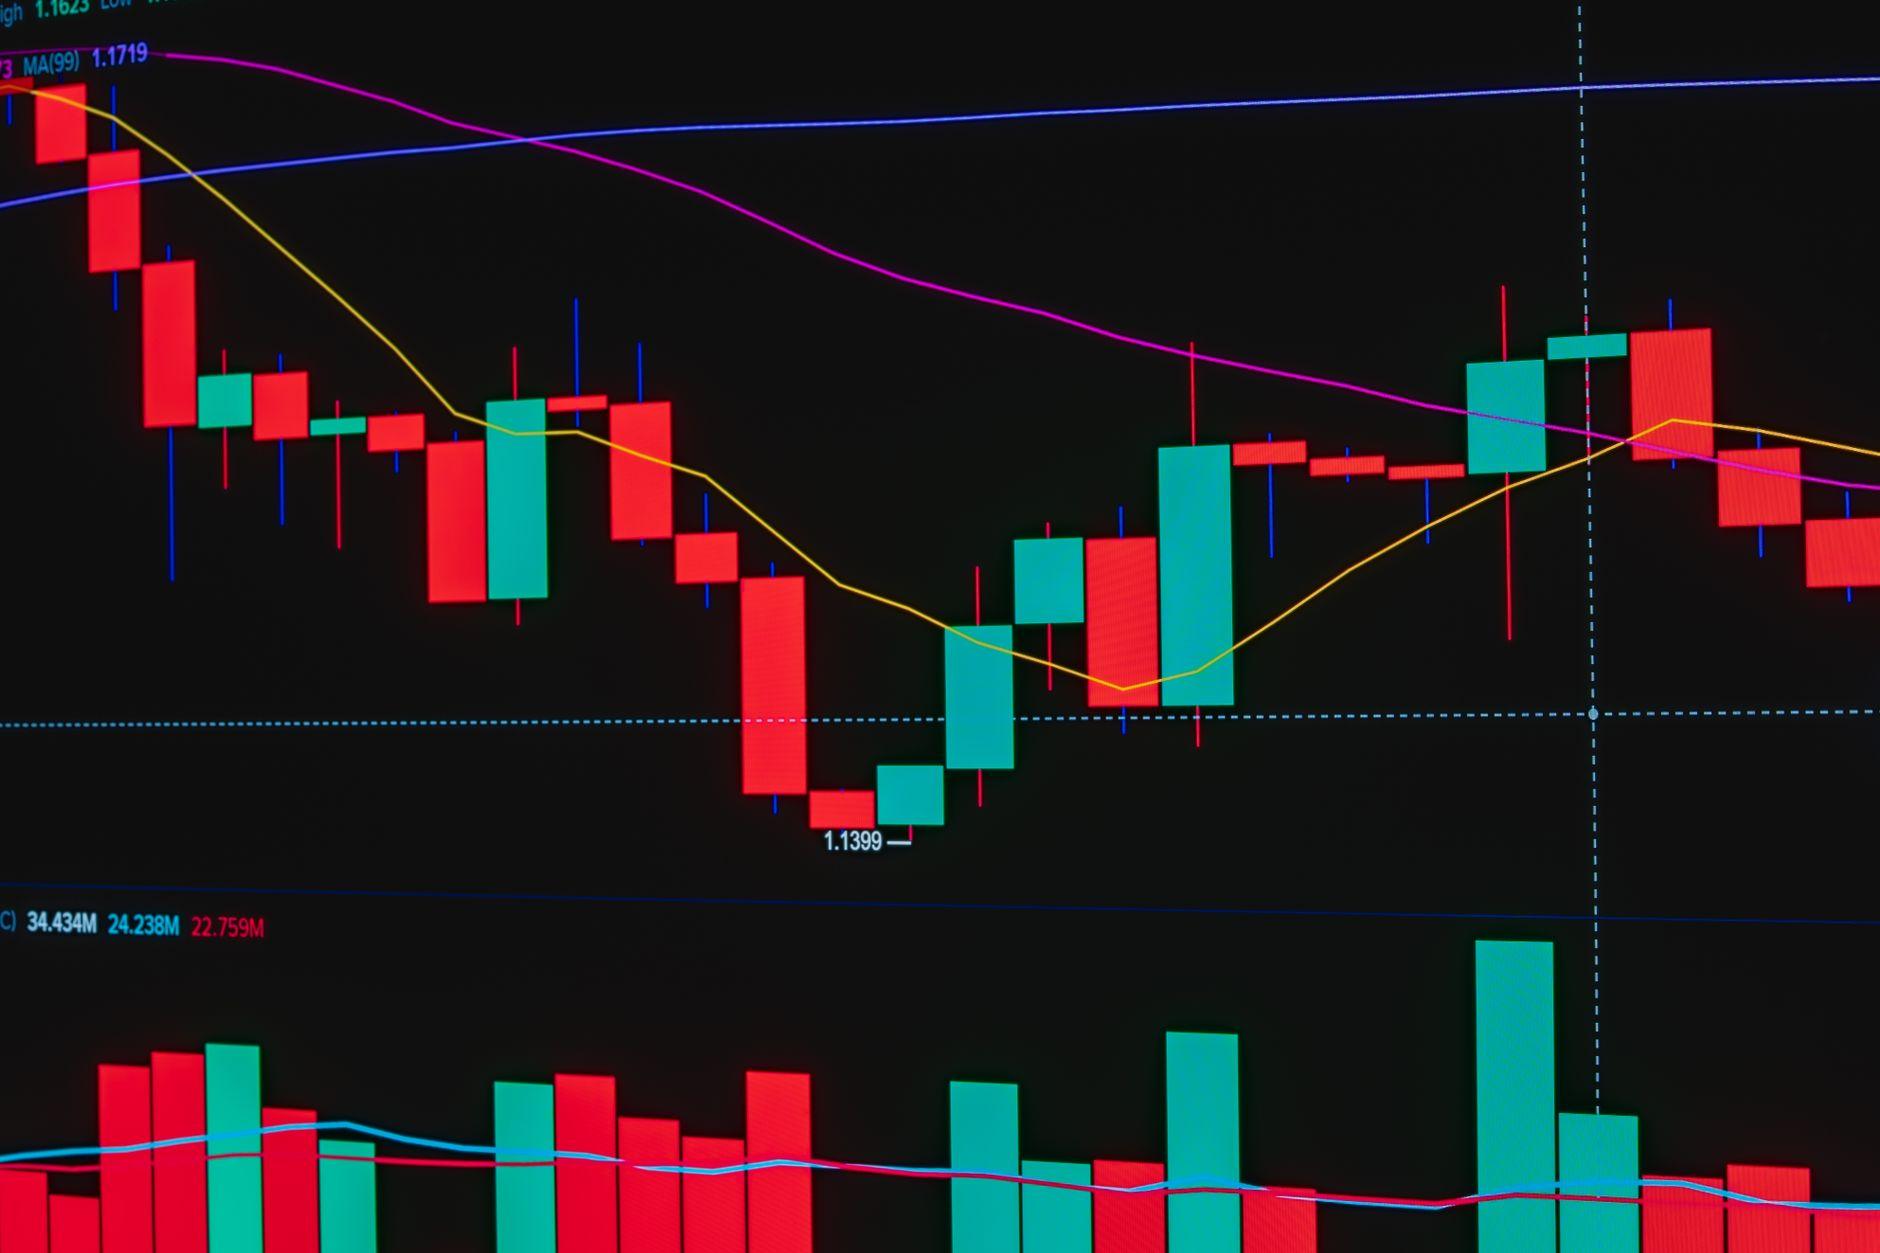
How Historical Market Returns Compare Across Different Decades
Decades of Dollars: A Wild Ride Through Stock Market History
My portfolio took a nosedive in 2008, and frankly, I was furious. It made me wonder if the stock market was just a rigged game. But then I started digging into historical market returns, and man, what a different picture emerges when you look across the decades. You see some astounding growth and then, bam, some really rough patches. Think about the Roaring Twenties – things were booming, stocks were flying high, and people thought it would never end. Then came the Great Depression, and suddenly, fortunes were wiped out. It’s a stark reminder that past performance isn’t some crystal ball.
The 1950s, for instance, were often called the “Golden Age of Capitalism,” with solid, steady gains for investors. We’re talking average annual returns in the high single digits or even low double digits for many years. It felt like you could just buy and hold, and your money would steadily grow. Then you flip the calendar to the 1970s, and it was a whole different beast. We saw stagflation, which is this nasty combination of high inflation and stagnant economic growth. The stock market didn’t just dip; it really struggled, and it felt like a lost decade for many investors.
It’s absolutely mind-boggling when you look at the 1990s, the era of the dot-com boom. Tech stocks were exploding, and everyone wanted a piece of the action. Investors saw unprecedented gains, sometimes doubling their money in a single year. It was wild, and honestly, it felt like a whole new paradigm for investing. But then, of course, came the dot-com bust in the early 2000s. Many of those inflated tech companies vanished, and the market took a serious beating. That period, from 2000 to 2002, was particularly brutal, with the S&P 500 losing a significant chunk of its value – we’re talking over 40% from its peak. It really tested the resolve of anyone who had piled into those tech darlings.
And don’t even get me started on the 2008 financial crisis. The housing market collapse sent shockwaves through everything. Banks were failing, major indices like the Dow Jones Industrial Average and the S&P 500 plunged dramatically. Losing nearly 40% of your investment in a year is gut-wrenching. Investopedia has some fantastic charts showing just how volatile those periods were. It hammered home the point that diversification is king, but even diversified portfolios felt the pain.
The 2010s, on the other hand, were largely a period of recovery and sustained growth. After the dust settled from the financial crisis, the market embarked on a long, upward trend. While not as explosive as the dot-com bubble’s peak, these returns were more consistent and arguably healthier. Many investors who stayed the course saw their long-term investments grow substantially. You can find data on this from sources like the U.S. Securities and Exchange Commission (SEC).
However, it’s crucial to understand that these decade-long averages can be incredibly misleading. A terrible year sandwiched between good years can skew the overall picture, and vice-versa. For example, the 1930s were dominated by the Great Depression, with severe losses year after year. Yet, if you only looked at the decade’s average return, it might appear less dire than the actual lived experience of investors during that dark period. The Dow Jones lost an astonishing 89% from its 1929 high by 1932. That’s a level of devastation that makes current market fears seem almost quaint.
The biggest criticism I have of looking only at these historical numbers is that they don’t account for the psychological toll on individual investors. Seeing your life savings evaporate, even if the market eventually recovers over 10 or 20 years, is incredibly difficult. It’s one thing to read about a 10% average annual return and another to live through a 50% drawdown. The Federal Reserve Economic Data (FRED) provides a treasure trove of this information if you really want to get lost in the weeds.
So, what’s the takeaway? The stock market has historically been a powerful engine for wealth creation, but it’s never been a smooth ride. Different decades have presented vastly different environments, from hyper-growth to deep recessions. The only guarantee is volatility. Perhaps the most consistent historical market return is the return of investor panic.